Introduction to R and RNA sequencing
This course is designed to equip students with a robust skillset in R programming, data analysis, and advanced bioinformatics techniques, particularly in single-cell transcriptomics and spatial proteo-transcriptomic analysis. The curriculum is divided into two interconnected modules, ensuring a seamless progression from general data analysis skills to specialized applications in bioinformatics.
The first module focuses on building essential expertise in R scripting and navigating RStudio. Students will learn to implement best practices for analysis reproducibility within a controlled environment (e.g., with Renv and Conda), engage in data visualization, and produce structured data analysis reports with Rmarkdown and Shiny. Additionally, the module introduces the application of statistical methods in R, basic text analysis, and introductory machine learning techniques, providing a solid groundwork for further exploration in data analysis fields of the student's choice. Instruction is delivered through a combination of lectures and practical hands-on seminars. During these sessions, students participate in live data analysis under the guidance of experienced instructors, engage in interactive assessments, and have ample opportunities to ask questions.
The second module focuses on the bioinformatics of single-cell transcriptomics and spatial proteo-transcriptomic analyses. This advanced segment emphasizes data processing and classical downstream analysis using R and relevant packages, while also introducing key concepts of multiomics analysis, including data integration with scATAC-seq and CITE-seq. Students will gain hands-on experience with spatial biology techniques such as 10x Visium, 10x Visium HD, and Imaging Mass Cytometry, enabling them to evaluate cell identities and marker expressions within tissue microenvironments. The module includes voluntary supervised team capstone projects, preparing students for independent work in real-world settings. Each session comprises the key activity (lecture or seminar), followed by a Q&A, troubleshooting, and discussion round. Panel discussions with multiple instructors are incorporated where applicable, ensuring comprehensive coverage of up-to-date techniques and live data analysis.
Throughout the course, students are divided into small groups to stimulate collaborative learning and are assigned homework to reinforce their knowledge and enhance troubleshooting – however, all the sessions are being held as a common track. Collaboration with groupmates and instructors and the use of generative models for troubleshooting are encouraged, although plagiarism is strictly prohibited, and ethical applications of the generative models will be instructed. The entire course content is delivered in Ukrainian, supplemented with the necessary English terminology and background required for utilizing R packages effectively.
The course culminates in a team project analyzing expression data from publicly available datasets, including presentations and instructor feedback.
All instructors are experienced data analysts and bioinformaticians. Their expertise, developed through routine job responsibilities, publication track, and prior teaching engagements, ensures high-quality instruction and relevant, practical insights throughout the course.
Overviewing the features of R and Rstudio, introduction to basic R syntax and data types (numeric, boolean, strings, vectors, lists, matrices, dataframes, dates, factors, etc.) and operations with them.
Contents: Introduction to loops (while loops, for loops) and functions. Applying functions via apply and map functions as an alternative to loops.
Introduction to the tidyverse package and its features. Introduction to data loading, data exploration, and data manipulation with the tidyverse package.
Introduction to data visualization with the ggplot2 package. Exploring different types of plots for different data types. Customizing your plot with different color palettes, themes, etc.
Loading, and cleaning text data. Introduction to bigrams and ngrams. Creating wordclouds. Sentiment analysis. Introduction to topic modeling.
The use of RMarkdown for creating dynamic and reproducible reports. Learn how to integrate code, results, and narrative seamlessly to produce professional-quality documents. Topics include formatting, embedding visualizations, parameterizing reports for different outputs, and best practices for project documentation to facilitate collaboration and publication.
Methods of copying data from electronic tables and uploading data saved in comma-separated format. Calculation of mean, median, and variance in the base package. Testing for normality and equality of variances. Parametric pairwise comparisons and analysis of variance, using ‘base’, ‘DescTools’, and ‘coin’ packages.
Graphics in ‘base’ and ‘ggplot2’ and specialized packages (‘corrplot’, ‘pROC’, etc.): boxplots, correlation tables, trendlines, biplots, heatmaps, dendrograms, receiver operating characteristic (ROC) curves, odds ratios, and response surfaces.
The use of regression analysis, including a simple linear regression. Including categorical data and interactions into the regressions. Interpreting the output of the regressions. Dealing with multicollinearity and heteroskedasticity. Regression analysis with binary dependent variables.
Introduction to data wrangling techniques in R using packages like dplyr and tidyr. Learn how to clean, transform, and manipulate datasets to prepare them for analysis. Topics include filtering, selecting, mutating, summarizing data, and handling missing values to ensure data integrity and usability.
Advanced data manipulation strategies in R, including reshaping data, joining multiple datasets, and working with complex data structures. Explore best practices for efficient data processing, optimizing code performance, and automating repetitive tasks to streamline the data analysis workflow.
Introduction to reproducible research and the importance of reproducible pipelines in data analysis. Overview of Docker and containerization concepts tailored for R environments. A step-by-step guide to setting up Docker containers for R projects to ensure consistency across different systems. Creating and managing R scripts and their dependencies within Docker containers. Best practices for version control, automation, and documentation in reproducible workflows. Demonstration: Building a simple reproducible R pipeline using Docker, including environment setup, script execution, and container management.
Introduction to Conda and its role in environment and package management for data science projects. Setting up Conda on various operating systems and configuring basic environments. Creating, cloning, and managing Conda environments to handle different project dependencies effectively. Installing and updating packages using Conda, including handling complex dependencies and channels. Integrating Conda environments with popular IDEs and tools like Jupyter Notebook and RStudio. Best practices for environment sharing and reproducibility using environment.yml files. Troubleshooting common issues in Conda environments and optimizing environment performance.
Brief introduction of Machine Learning types, implementation of R packages for classification and regression (caret, randomForest etc.).
Building interactive web applications with R. Putting together layouts, themes, graphics, and interaction with users (feedback, upload, download).
Comparative analysis of R and Python for bioinformatics and data science applications. Discuss the strengths and weaknesses of each language, scenarios where one may be preferred over the other, interoperability between R and Python, and best practices for integrating both tools into a cohesive workflow. Explore key libraries and frameworks that support advanced data analysis in both environments.
A series of meetings dedicated to developing own R workflow on a publicly available dataset, including exploratory, statistical analysis, visualization, and reporting, according to the best practices.
A series of meetings dedicated to developing own R workflow on a publicly available dataset, including exploratory, statistical analysis, visualization, and reporting, according to the best practices.
A series of meetings dedicated to developing own R workflow on a publicly available dataset, including exploratory, statistical analysis, visualization, and reporting, according to the best practices.
A series of meetings dedicated to developing own R workflow on a publicly available dataset, including exploratory, statistical analysis, visualization, and reporting, according to the best practices.
NGS technologies (sequencing by synthesis, nanopore), library preparation, experimental design, output files, and general steps for reads preprocessing.
Theory and practice on Principal Component Analysis, Multidimensional Scaling, tSNE, UMAP.
Introduction of the main dataset used in the course. Walk through the main stages and scripts of the single-cell RNAseq using the dataset and package Seurat. This includes quality control, feature selection, data normalization, linear and non-linear dimensionality reduction, clustering, annotating cell types, and identifying markers.
Advanced techniques in single-cell RNA-seq analysis, including trajectory inference, differential expression analysis across conditions, and integrating additional data modalities to enhance biological insights.
Introduction to the Harmony package. Installation, and introduction of the datasets for the tutorial. Data integration with Harmony using Seurat package.
Exploration of long-read sequencing technologies in single-cell RNAseq, comparing their advantages and challenges relative to short-read methods, and discussing their impact on transcriptome analysis.
Technology landscape. Main approaches in data integration.
Details on the ATAC-seq samples preparation, and considerations. Examples of application.
Going through the main stages of single-cell ATAC-seq analysis with package Signac. RNA-ATAC integration: Weighted nearest neighbor analysis, cell type gene/pick identification, and visualization of chromatin accessibility profiles. TF binding motif enrichment analysis.
Principles and practices of CITE-seq, covering sample preparation, antibody tagging, and appropriate usage of the technique.
Practical introduction into the integration and CITE-seq data analysis to enable simultaneous single-cell transcriptome and protein expression profiling.
Advanced Clustering Techniques: Exploration of state-of-the-art clustering algorithms tailored for high-dimensional single-cell data, including graph-based and density-based methods. Algorithmic approaches for clustering evaluation (cluster stability, cluster silhouette). Beyond UMAP: a review of alternative dimensionality reduction techniques (e.g., PHATE).
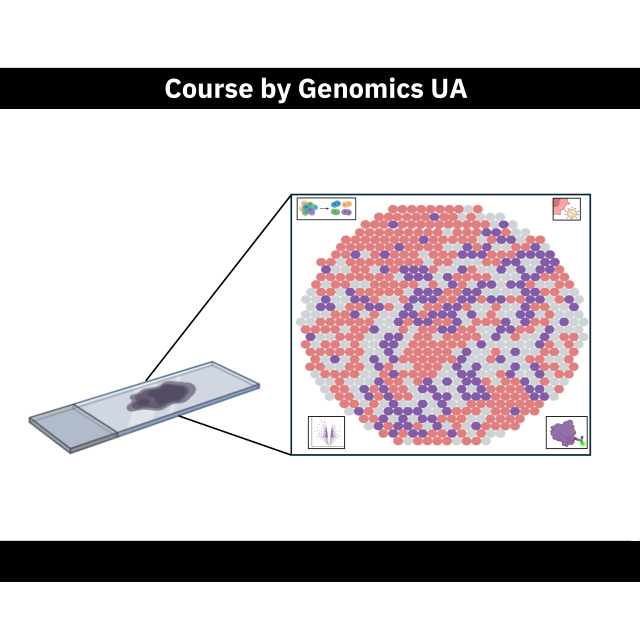
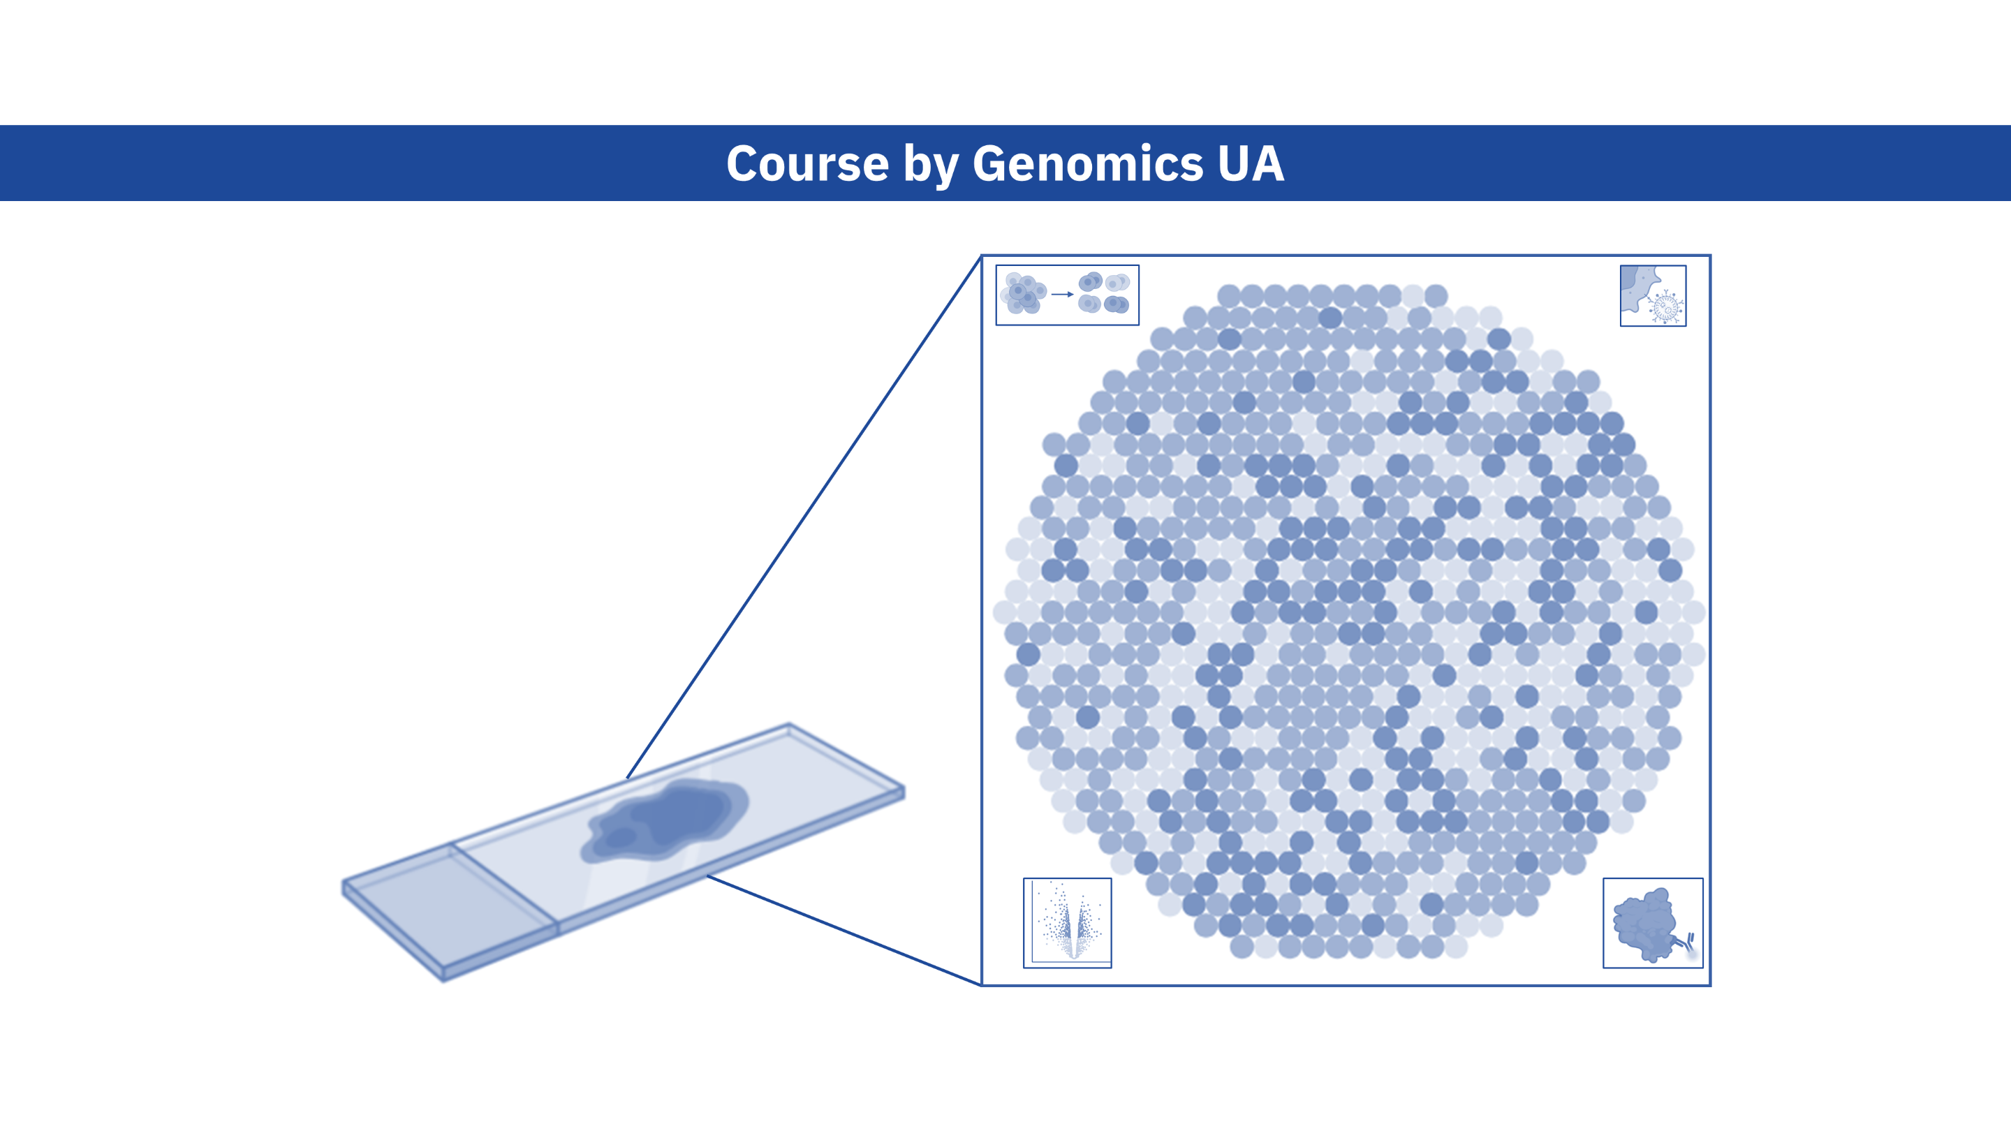
Tools for spatial analysis of tissue and cellular structures, coupled with multiplexed data collection techniques. Illustrate their use for the examination of tumor microenvironments and cellular heterogeneity.
An overview of the 10x Visium spatial transcriptomics technology and its capabilities in mapping gene expression within tissue sections. Methods for dissecting and understanding the complex interactions between different cell types within their native tissue context. Approaches for integrating spatial transcriptomics data with other datasets and advanced visualization techniques to interpret spatial gene expression patterns.
Overview of Imaging Mass Cytometry technology, including its principles, instrumentation, and applications in high-dimensional cellular analysis.
Fundamentals of analyzing Imaging Mass Cytometry data, including data preprocessing, normalization, and initial exploratory analysis techniques.
Advanced strategies for Imaging Mass Cytometry data analysis, such as spatial pattern recognition, cell population identification, and integration with other omics data.
An introduction to data and open science repositories (ENA, NCBI, OSF, Zenodo). Data management in collaborative project development and on high-performance computers/clusters. Data usage according to FAIR principles.
Presentation of students’ projects and instructors' feedback. These two sessions involve all instructors.
Presentation of students’ projects and instructors' feedback. These two sessions involve all instructors.