Statistics and data visualization for life sciences

The course comprises lectures and hands-on sessions devoted to the basic methods of statistical analysis and data presentation used by biologists. It will teach how to correctly calculate confidence intervals for values; build and use calibration curves; compare sample means; conduct statistical testing and account for multiple comparisons; do analysis of variance (ANOVA); select which test to use for analysis; do no-linear regression analysis; present data in clear and straightforward manner. All the discussed statistical tests are broadly used in scientific publications in the field of life sciences. The course also contains a chapter related to the design of experiments and the rules for creating graphs for journal articles.
Population. Range. Variational series. Sample. Sampling techniques and randomization. Mean. Median. Quartiles and percentiles. Probability distributions: normal, binomial, Poisson, Pearson, and others.
Cause of measurement errors: instrument errors, method errors, environmental errors, and observer errors. How errors can affect data analysis and interpretation? Minimizing measurement errors: calibration, repeated measurements, error correction techniques. Absolute and relative errors. Error propagation. Techniques for quantifying uncertainty due to measurement errors.
Standard deviation. Standard error of the mean. Z-test, Z-score. Confidence interval and confidence level. Statistical hypotheses. Student's t-test. P-values: definition, interpretation, common misconceptions. Tests for normality.
Selection of graph type. When (not) to use bar graphs. Box plots and strip plots, X-Y scatter. Logic and consistency in color coding of data. The balance between size and information. Text marks, figure legend, figure caption, axis labels.
Randomized, randomized block, factorial, and others. Replication. How to calculate the required sample size? Surveys and questionnaire design. Reporting results.
Analysis of variance (ANOVA). Tests for homogeneity of variances. Multiple testing. Tukey's honestly significant difference test. Dunnett's test. Scheffe's test. Corrections for multiple testing.
Analysis of non-normally distributed data. Chi-Square (χ2) test. Survival analysis. Mann-Whitney U test. Kruskal-Wallis test.
Mean, median, mode, range, variance, standard deviation. Performing statistical tests with Python (t-test, chi-square test, ANOVA). Handling outliers: removal, transformation, imputation.
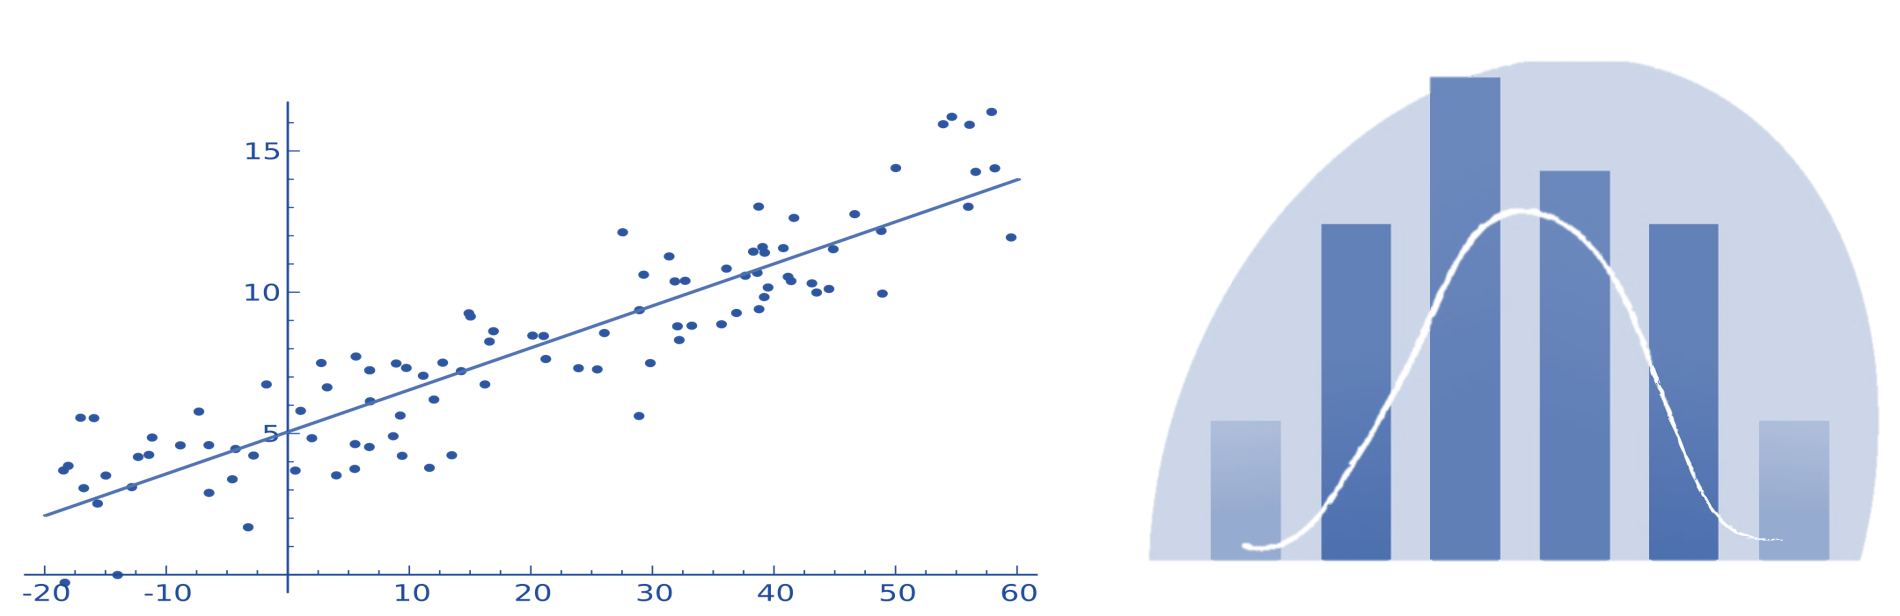
Pearson correlation coefficient. Spearman’s Rank Correlation. Linear regression. Calibration curve. Least square approximation. Residual Analysis: Definition, residual plots, checking assumptions of linear regression.
Exponential, logarithmic, polynomial, power, sigmoidal, and more. Techniques for estimating parameters in non-linear regression, such as least squares and maximum likelihood estimation. The process of constructing a curve that best fits the data points in a non-linear fashion. Overfitting and underfitting. Model selection. Applications of non-linear regression.
Raster and vector images. Software and file types. Representation of colors (CMYK, RGB, HSL). Storytelling with data. How to guide the reader's eyes: contrast and highlights. Readability of graphs. Fonts, line thickness. Hierarchy. Alignments.
Data import. Visualization.
Origin software.
Іспит буде проводитися 24.10.2024 (четвер) у формі онлайн-тестів.
Ви зможете проходити іспит в зручний для вас час між 16:00 та 20:00
Час для відповіді (40хв) відраховуватиметься з моменту переходу на форму з запитаннями.
Слідкуйте за часом самостійно.
Врахуйте, що деякі запитання передбачатимуть невеликі розрахунки які зручніше зробити за комп'ютреом (Excel).
Частина запитань передбачає що ви відмітите всі правильні відповіді ("галочки")
Посилання на форму буде розміщено тут а також в телеграм-чаті курсу.